KC dashboard: design review

A mockup of the Track tab with the changes from the review, built on the kovademo account. Nothing in the live dashboard has been changed. Flip between versions to compare.

October's month-to-date figures in "Proposed" are illustrative. The demo account had no October sales synced when this was built, so the live tab shows "Waiting for data" (see "No data yet" for how that state should look). Every other number is copied from the demo account.
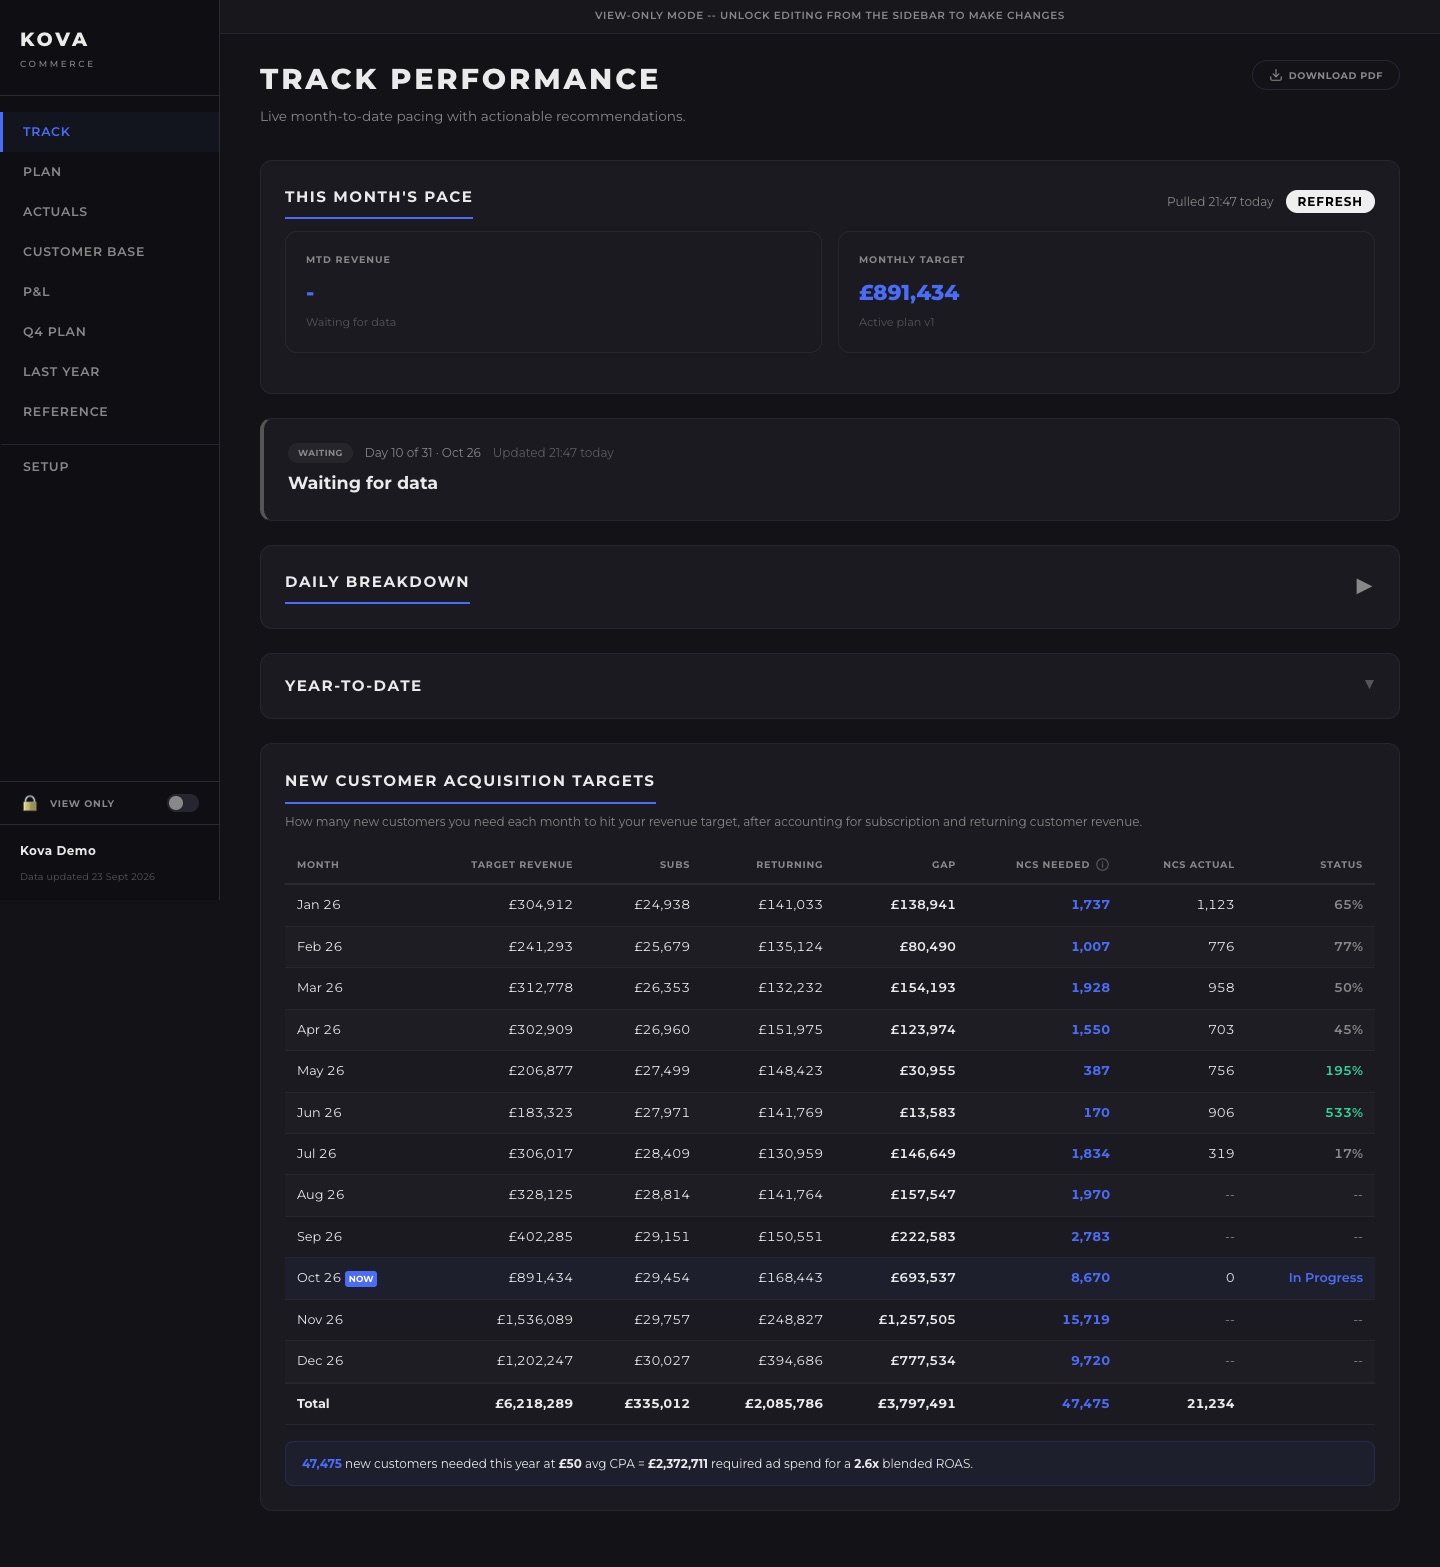
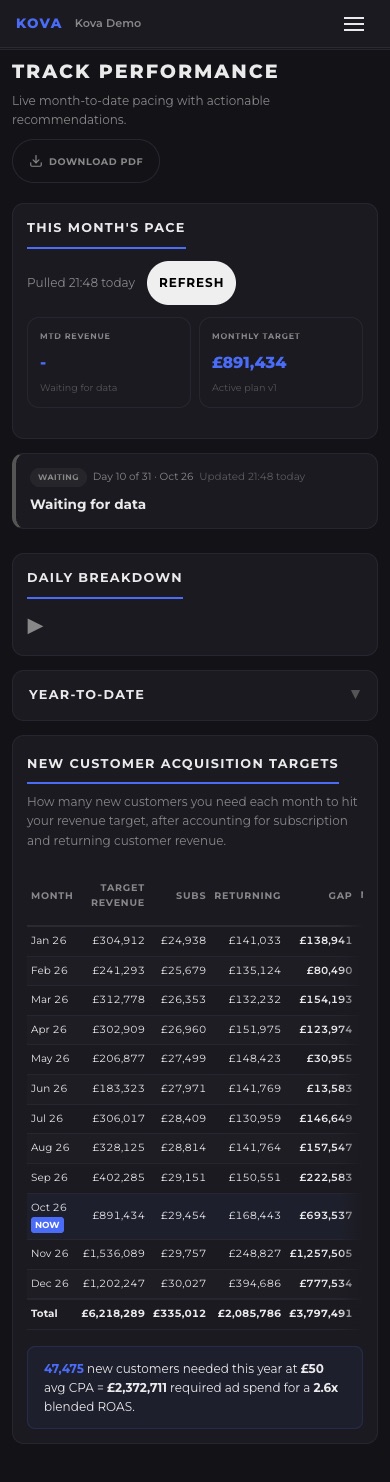
Screenshot of the current Track tab on the demo account Screenshot of the current Track tab on a phone
KOVAKova Demo
You're viewing, not editing.

Track

October 2026 · day 10 of 31 · synced 21:47 today

£251,300in so far, of the £891,434 target

At this pace October lands on £779,030, which is £112,404 short of target.

£01 Oct
£287,559plan by today
£891,43431 Oct
£36,259 behind plan
To land the target you need £30,483 a day for the next 21 days. You're averaging £25,130 a day so far.
Projected month end
£779,030
Ad spend so far
£96,000 of £433,500
Blended ROAS
2.62x plan 2.6x
New customers
1,920 of 8,670

October's sales haven't come through yet

Shopify last synced at 21:47 and returned no orders for October. That usually means the store connection needs re-authorising, or the sync is still running. Your target and plan are unaffected.

£01 Oct
£287,559plan by today
£891,434October target

New customers needed, month by month

NeededWon, coloured by hit rate

October to December needs 34,109 of the year's 47,475 new customers (72%). At the plan's £50 average cost per customer that is £2,372,711 of ad spend for the year, for a 2.6x blended ROAS.

Month Target revenue Subscriptions Returning Left for new customers Needed Won Hit rate
Year£6,218,289£335,012£2,085,786£3,797,49147,47521,234

Hit rate is new customers won against the number needed. Below 80% is behind, 80 to 99% is close, 100% or more is ahead.

What changed on Track, and why

The same data, re-ordered so the screen answers the Monday-morning question first: am I on pace this month, and what do I need to do about it?

  1. 1. The page opens with one sentence, not two tiles

    "£251,300 in so far, of the £891,434 target. At this pace October lands £112,404 short." The pace bar shows where you are against where the plan says you should be by today, and the next line turns that into a daily number.

    Was: two equal tiles (MTD revenue, monthly target) and a separate status card. The target and the actual were the same size and the same blue.

  2. 2. Behind looks like behind

    Three status colours: red for behind, amber for close, green for ahead. Each always comes with an arrow and a word, so nobody has to rely on colour alone. Blue now only means "you can click this".

    Was: no colour for behind anywhere in the product. "Behind" badges are grey, and the P&L legend says "grey = needs attention".

  3. 3. Empty state that tells you what to do

    "October's sales haven't come through yet", the likely reason, and two buttons. The target and the plan-by-today marker stay visible so the page still has value.

    Was: "–" and "Waiting for data" twice, with no reason and no next step.

  4. 4. The year table becomes a picture first

    Needed vs won per month as bars, so the Q4 cliff (Oct 8,670, Nov 15,719, Dec 9,720) is visible in a second. The table drops to five columns. Subscriptions and returning revenue sit behind one click, and Aug and Sep say "Not synced" instead of "--".

    Was: an 8-column table that clipped on phones at the "Gap" column, hiding the number that matters.

  5. 5. Quieter type, grouped navigation

    Sentence-case headings, no blue underline on every title, 12px minimum text, tabular numbers. Nine nav items grouped into Monitor, Plan and Understand, each with an icon, so the collapsed tablet sidebar still works.

    Was: 14 font sizes on one page, 7 of them between 8.8px and 13.6px. On tablets the sidebar sets font-size to 0, so the nav goes blank.

  6. 6. Contrast that passes

    The faint grey (#555) used for "Active plan v1", "Waiting for data" and "Data updated" is 2.3:1 on the cards. It's replaced by #8A8A94 (4.9:1). The "View only" banner becomes one line with an Unlock link.

    Was: the automated scan flagged 9 low-contrast items on Track, 45 on Customer Base and 79 on P&L.

The same ideas on other tabs

Two small before-and-after examples, so you can see the colour rules and the warning cleanup carry across.

P&L: losses currently show in green

In the Monthly P&L, Net Operating Profit is green because the row type is green, whatever the sign. A founder skimming this reads seven months of losses as fine.

Current
LineJan 26Feb 26Mar 26Apr 26May 26
Gross Profit£119,741£95,201£99,129£94,521£89,344
Net Operating Profit£-5,767£-9,806£-6,742£-20,031£-45,068
Proposed
LineJan 26Feb 26Mar 26Apr 26May 26
Gross profit£119,741£95,201£99,129£94,521£89,344
Net operating profit−£5,767−£9,806−£6,742−£20,031−£45,068

Colour by sign, not by row. Minus sign in front of the £, as an accountant would write it.

Plan: two warning cards that say the same thing

"Profitability warning" and "Feasibility warning" both open with "At CPA of £51.75, 10 months exceed the spend ceiling" and both show £83.37. The break-even figures are in celebratory green inside a warning. One picture explains all five cost-per-customer numbers at once.

Current
Profitability warning

At CPA of £51.75, 10 months exceed the spend ceiling.

Your assumed cost per customer£51.75
Break-even (1st order)£32.94
Break-even (6-mo repeat value)£64.94
Break-even (12-mo repeat value)£83.37
Feasibility warning

At CPA of £51.75, 10 months exceed the spend ceiling.

Max viable cost per customer£37.81
Break-even (12-mo repeat value)£83.37
Proposed

This plan loses £522,430 a year

Your £51.75 cost per customer is above what the spend ceiling allows in 10 months. Customers do pay back, but only after about 3 months of repeat orders.

£32.94break even, 1st order
£37.81spend ceiling
£51.75your cost
£64.94pays back, 6 mo
£83.37pays back, 12 mo

Lower your cost per customer to £37.81 to fit the spend ceiling, or £32.94 to profit on the first order.

Not design, but you'll want to know

The same figure shows different values on different tabs of the demo account. In a finance tool this does more damage to trust than any visual issue, and a sharp prospect will spot it on a demo call. Some may be different bases (saved plan v1 vs a live recalculation, inc-VAT vs ex-VAT), but if so the screen doesn't say which.

FigureOne tabAnother tab
October revenue target£891,434 (Track)£877,295 (Plan, monthly table)
January plan£304,912 (Track)£298,211 (Plan vs Actual)
New customers needed this year47,475 at £50 (Track)52,299 at £52 (Plan)
Annual result−£522,430 (Plan)−£643,290 tile, −£1.1M breakdown (P&L)
Monthly overhead£38,923 tile, £48,000 input (Setup)£47,300 (P&L)
Does a new customer pay back?"Pays back on the first order" (Customer Base)"Each new sale loses money on the first order" (Plan)

Scores

Nielsen's ten usability heuristics, 0 to 4 each. Most real products land between 20 and 32.

Total21 / 40Acceptable, bottom of the band
Strongest3Help: the Reference tab, formula reveal and plain-English sentences
Strongest3Control: view-only lock, month locking
Weakest1Consistency: same figure, different values
Weak2Six others, mostly hierarchy, colour and empty states

Built 10 Oct 2026 from the kovademo account. This page is unlisted and not indexed by search engines, but anyone with the link can open it.